
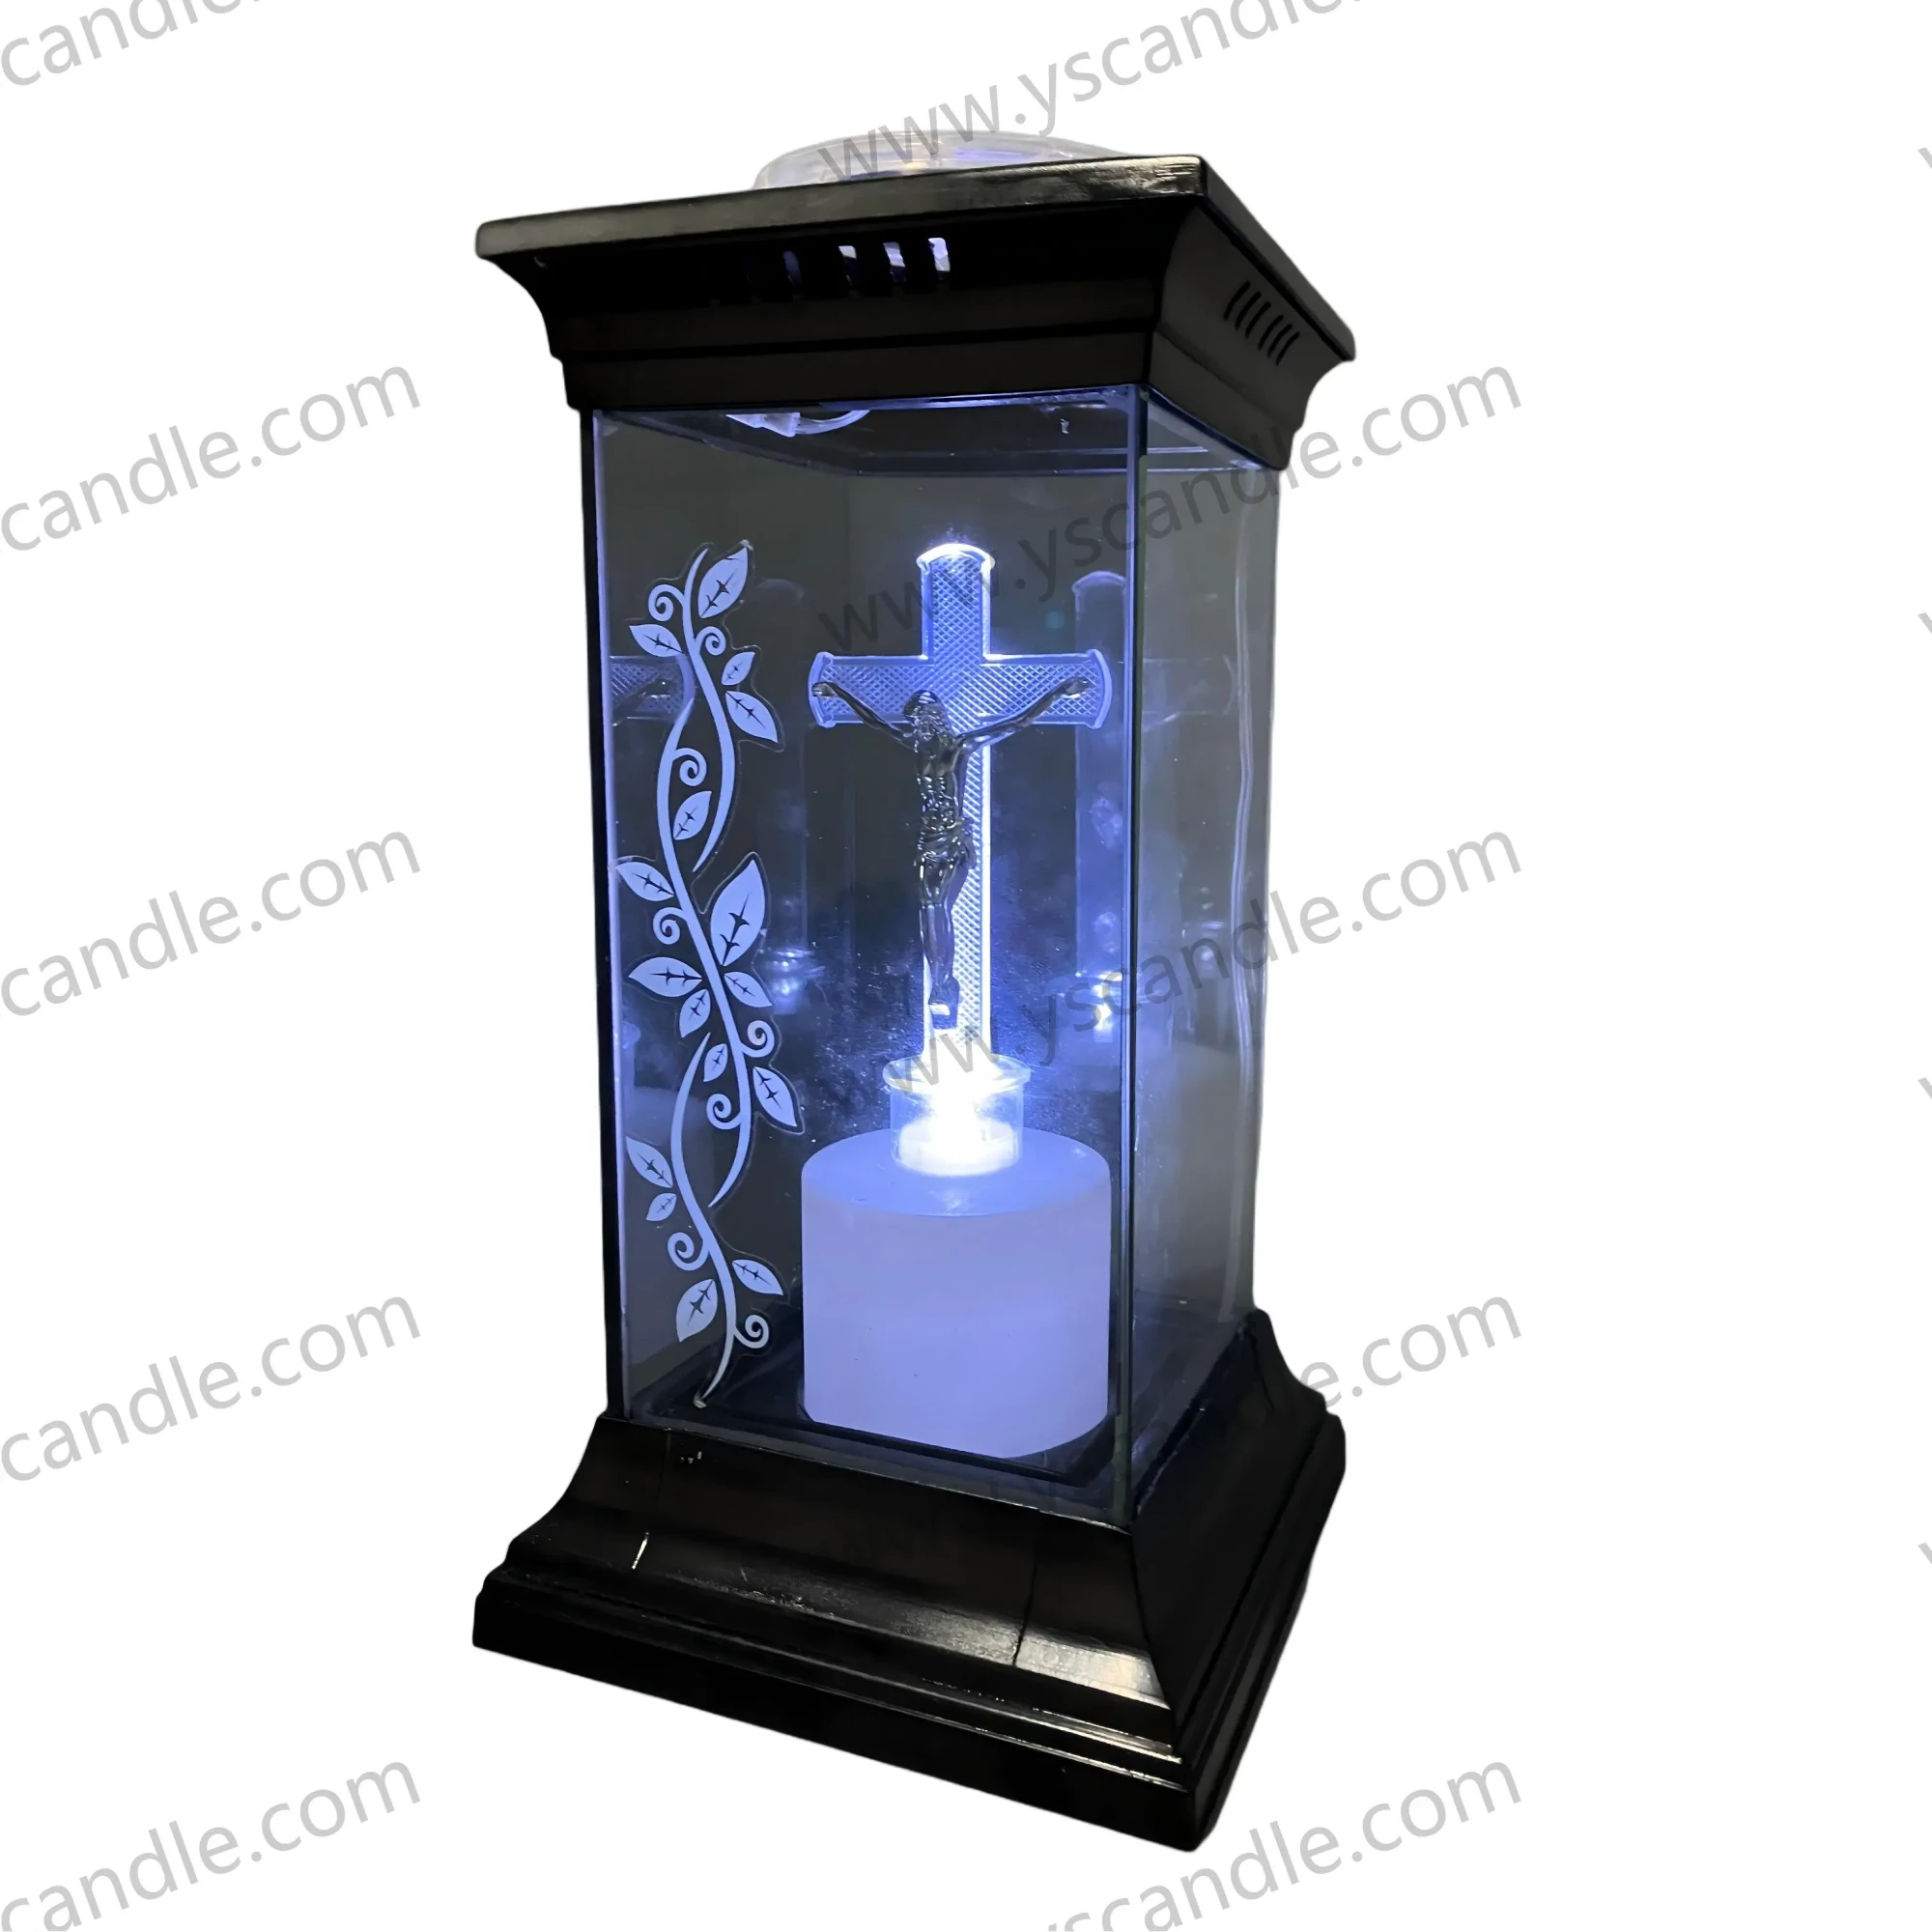
The candle is fine. It flickered correctly for the demo, the flame looked right, and the customer signed off. Then, four weeks later, the same candle sat dark on a hotel guest’s nightstand, dead, on a full-charge that should have lasted a week.
\n
This is the failure mode that quietly kills LED candle brands. Not a broken LED, not a bad flame effect x97 the battery. And the reason it keeps biting you is that most of the industry specs out there measure the wrong thing.
\n
The marketing number is a lab number
\n
Open any spec sheet and you’ll see a line that reads something like “battery life: 100 hours.” That number has a lot of invisible asterisks attached. It assumes a brand-name AA cell, a fresh one, tested at 25xb0C, with the LED running at a constant current, and a control chip that draws almost nothing in standby. Real deployments break one or all of those assumptions.
\n
Here’s what actually moves the runtime in a flameless candle:
\n
- \n
- Cell chemistry and sourcing. A $0.40 bulk AA cell can run 30% shorter than a premium one at the same nominal 2.0V, simply because of internal resistance drift. Cheap cells hit the dim-out threshold faster under load.
- Standby draw. This is the big one nobody talks about. A candle that’s “off” but with its motion sensor, touch sensor, or RF receiver active can sip 15x9640xb5A continuously. Over a month, that’s enough to kill a 2000mAh cell even if it was never lit. A candle with a well-designed low-power sleep state (under 1xb5A) will outlast one by weeks.
- Flicker mode cost. The dimming algorithm itself is a load. A smooth, slow flicker on a high-efficiency constant-current driver costs less per hour than a sharp, fast flicker on a resistor-dropped LED. Two candles that look identical to a customer can differ by 20×9640% in runtime because of the driver topology alone.
- Temperature. Li-ion and alkaline both sag below 10xb0C. A candle in a storage warehouse in January will test noticeably worse than the same candle in an air-conditioned showroom x97 and your QC pass/fail threshold is probably set on the showroom’s weather.
\n
\n
\n
\n
\n
The two numbers that actually predict the failure
\n
If you’re building a runtime spec that survives contact with the real world, you need two measurements, not one:
\n
1. Load-time at 80% capacity, at 4 temperatures
\n
Don’t measure “time until dead.” Measure time until the LED’s luminous flux drops to 80% of its rated value. Run the same cell through a load test at 25xb0C, 15xb0C, 5xb0C, and -5xb0C. The spread between those four curves tells you more about your cell sourcing than any marketing number. If the 5xb0C curve collapses while the 25xb0C one holds, you have a sourcing problem, not a design problem x97 and you can fix it by changing suppliers before it becomes a customer complaint.
\n
2. Self-discharge over 30 days, unlit
\n
Charge a set of cells to full, store them unlit at 25xb0C for 30 days, then measure their actual capacity. A well-designed system (good cell, low standby draw, protection IC with decent self-discharge specs) will lose less than 3% of capacity in a month. A badly designed one can lose 10×9615%. That’s the difference between “the candle was in storage and is still bright” and “the customer unboxed a dead product.”
\n
This test is cheap to run. It requires a capacity meter, a temperature chamber (or just a warm storage room), and a calendar. Most candle QC labs skip it because it’s slow. That’s exactly why it should be your differentiator in spec sheets x97 it’s the number that predicts the real failure, and almost nobody reports it.
\n
The protection IC is doing more work than you think
\n
In a rechargeable candle, the battery protection IC is the component that decides whether your candle lives or dies in the field. The failure modes you see in the returns pile map almost 1:1 to IC weaknesses:
\n
- \n
- Over-discharge protection that cuts too early. Some cheap ICs trip at 2.8V on a 3.7V cell, which looks protective but actually throws away 15×9620% of usable capacity. Your candle “dies” while it still has enough charge to run for another week. The fix is specifying an IC with a 2.5V cutoff and hysteresis, and verifying the trip point on your BOM.
- Charging current that’s too aggressive for the cell. A 1C charge profile on a small 800mAh button cell is fine. A 1C charge on a 200mAh micro-cell, especially in a candle that sits near a heat source (a lamp, a radiator), can generate enough internal heat to accelerate capacity fade by 30% over a year. Check your charging profile against the cell datasheet’s max charge rate, and retest capacity fade at 40xb0C storage.
- Standby current of the IC itself. Some protection ICs draw 5x9610xb5A in “off” state. Others draw under 1xb5A. In a small-cell candle, that difference is a 20×9650% runtime swing. It’s the cheapest performance upgrade available on the BOM and most spec sheets don’t list it.
\n
\n
\n
\n
What to actually test before you ship
\n
Here’s a minimal test sequence that catches the failures that actually end up in complaint tickets, in the order of cost-effectiveness:
\n
- \n
- Runtime at 25xb0C, 50% duty cycle, until 80% flux. This is your baseline. If you can’t hit your target here, nothing else matters.
- Same test at 5xb0C. If the spread is more than 25%, your cell sourcing or your driver is temperature-sensitive. Both are fixable, but you need to know which.
- 30-day self-discharge at 25xb0C, unlit. The number that predicts the “dead on arrival” complaint. Report it in your spec sheet x97 it’s a differentiator almost nobody uses.
- 100-charge cycle test at 40xb0C, then re-run the 25xb0C runtime. This catches capacity fade that won’t show up until month 6 or 12 in the field. It’s the longest test on the list, but it’s the one that separates a candle that lasts two years from one that dies at 18 months.
- Standby current measurement with a xb5A-scale meter, “off” state, no sensors active. If it’s above 5xb5A, you’ve found a fixable runtime leak before the customer does.
\n
\n
\n
\n
\n
\n
Each of these tests is available on a bench with a capacity meter, a current meter, and a temperature chamber. None of them require a lab. And all of them predict a failure mode that the “100 hours” marketing number will never tell you about.
\n
The spec sheet your customer actually needs
\n
The next time someone asks “how long does this candle last,” the honest answer is a two-number answer: here’s the runtime at room temperature, and here’s the capacity retention after 30 days of storage. The first number tells them what the candle does today. The second tells them what the candle will do in a month x97 which is when the complaint ticket gets opened.
\n
The industry’s “100 hours” number is a lab result. The failures you’re actually seeing are storage, temperature, and standby-current failures. Test those three things, report both numbers, and the “dead in 90 days” tickets start looking like an anomaly in your data instead of a pattern in your returns.
\nx0a
Recommended battery LED candles: